Screenshots
Here you can see screenshots demonstrating the main features of the program. Need more information about the features? Features list
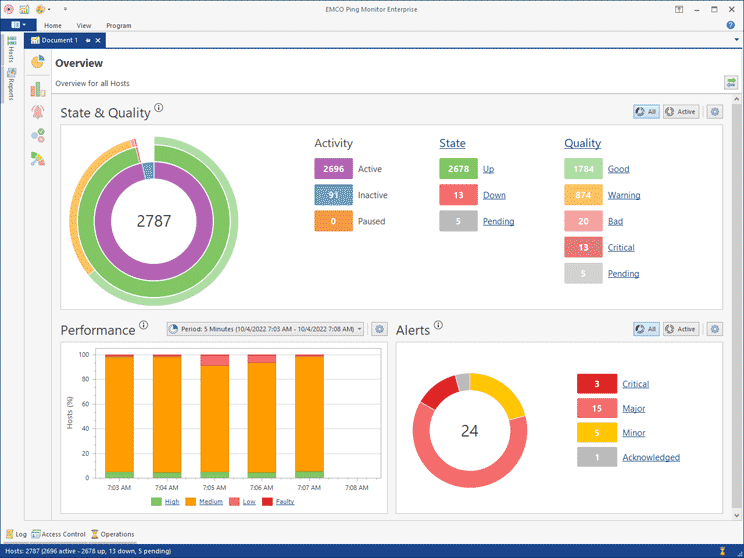
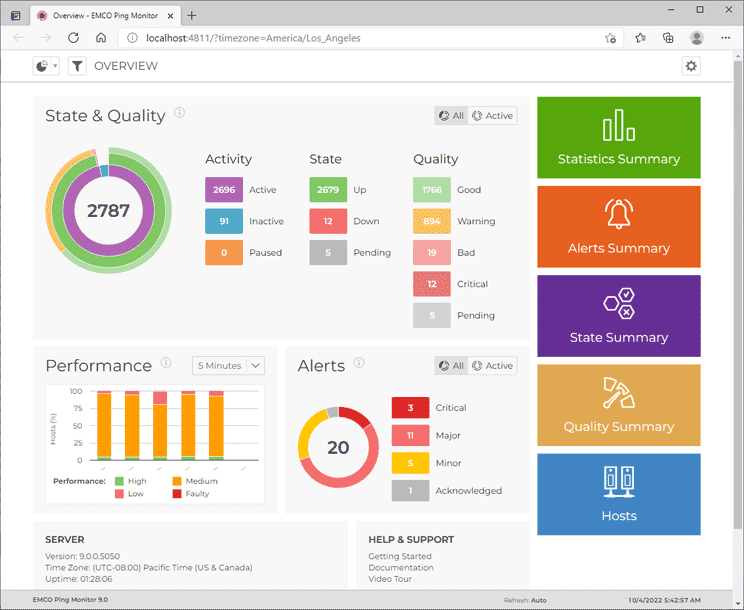
System State Overview
Overview displays the general statistics of the monitored hosts, including the total number of monitored, inactive and paused hosts. It also shows the total number of hosts with different states and qualities. You can click on the displayed numbers to navigate to the hosts with a particular activity, state and quality.
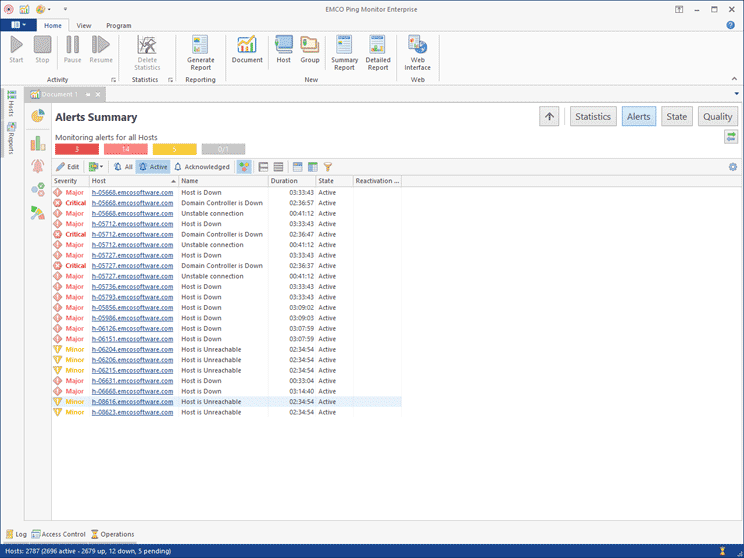
Alerts
All problems with monitored hosts are displayed as alerts that report a name of the host where the problem happened. Predefined alerts are reported when hosts are in the down state or when their connection quality is bad or critical. You can create custom alerts that will be reported on custom conditions, using any real-time characteristics of monitored hosts, such as state, quality, packet loss, latency, jitter, etc.
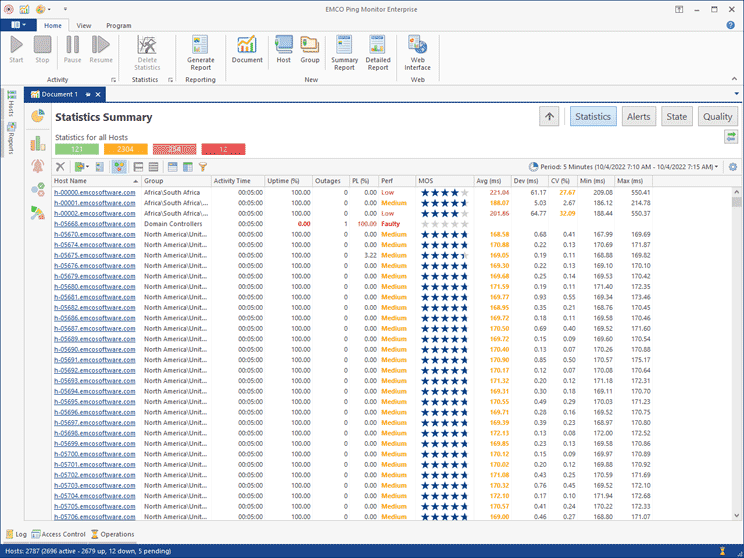
Statistics for All Hosts
The Statistics screen allows auditing the performance of your network for a selected historical period. You can select the required period (a custom date range or a recent period) and see the performance of all the hosts and their metrics for that period displayed on a single screen. You can sort and filter the displayed entries to focus on the required data only.
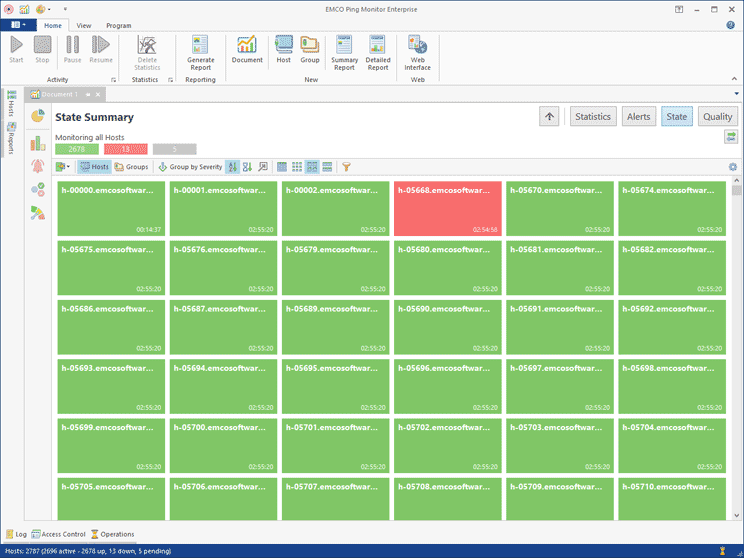
State Monitor
State Monitor is designed for a compact representation of the host states (Up or Down) on a single screen. It can display hosts as a table or as small, medium or large pictograms. The pictogram representation, available in the Enterprise edition of the program, can be used for real-time state monitoring in control rooms. Displayed hosts can be grouped, filtered and sorted to display the required hosts only.
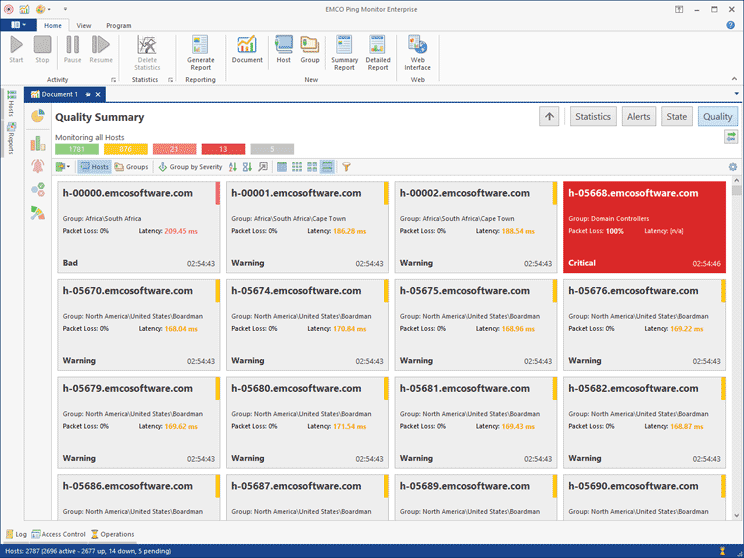
Quality Monitor
Quality Monitor displays the hosts' connection quality (Good, Warning, Bad or Critical) on a single screen. It can display hosts as a table or as small, medium or large pictograms. The pictogram representation, available in the Enterprise edition of the program, can be used for real-time connection quality monitoring in control rooms. The program detects the connection quality using configurable metrics. If a metric value exceeds the configured threshold, the connection quality is changed and the violated metric is highlighted.
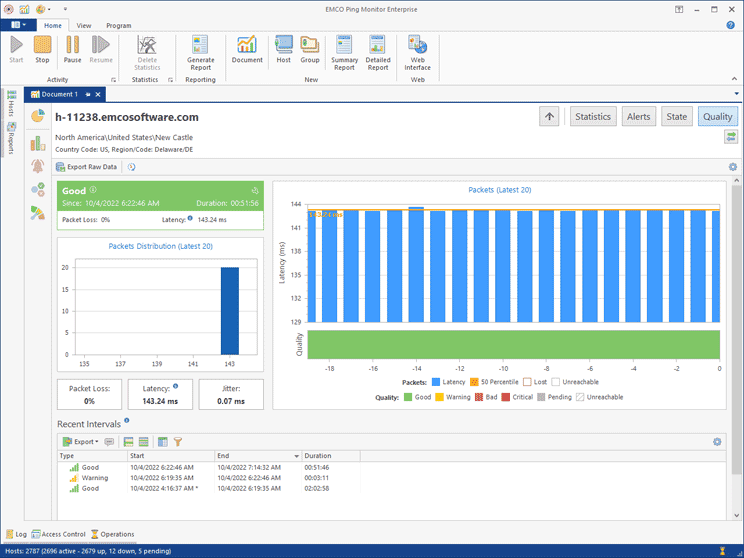
Host Quality Details
You can drill down from the general overview, which displays quality metrics for all the hosts/groups, to a selected host and see it's metrics in real-time. The host quality details screen displays the metrics, such as packet loss, latency and jitter. It also shows the latency of the latest pings on a chart.
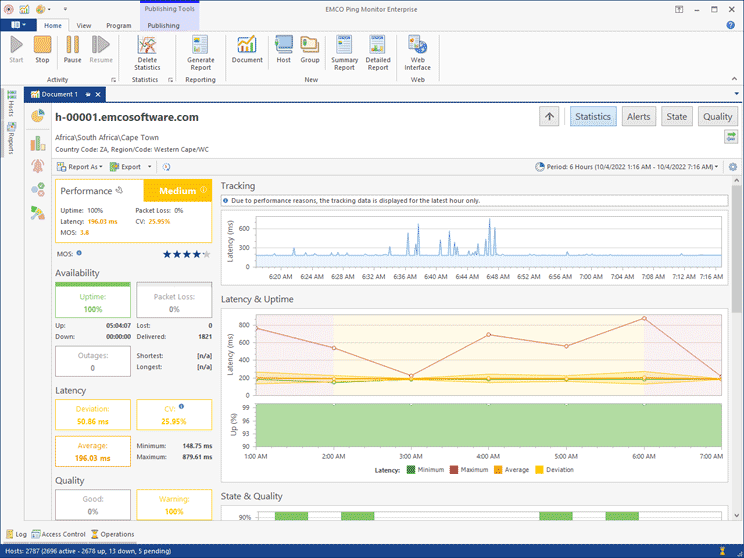
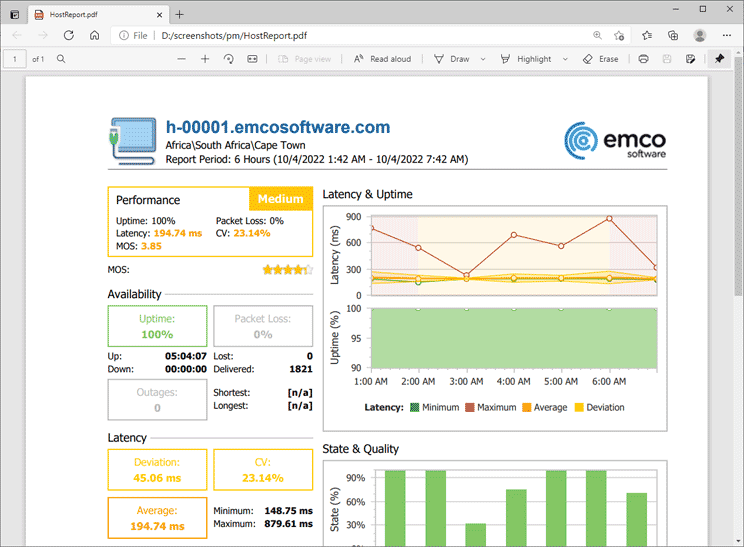
Host Statistics Details
If you need detailed information on the host statistics, you can drill-down to the host to see its data. The host statistics is displayed for a selected time range. It includes different metrics such as uptime, packet loss, latency, CV, MOS and others. The latency metrics, uptime, state and quality are displayed on charts. You can also see the number of outages for a selected period and the list of time intervals when the host had particular state and quality characteristics.
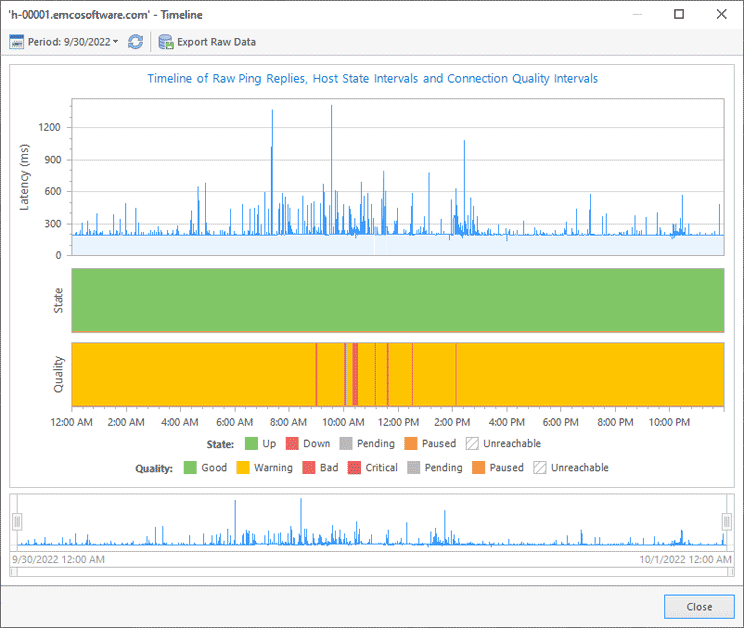
Host Timeline
Using Timeline, you can see ping data for a selected host displayed on a chart for a selected historical period. Timeline also shows the host state and the connection quality on the same screen.
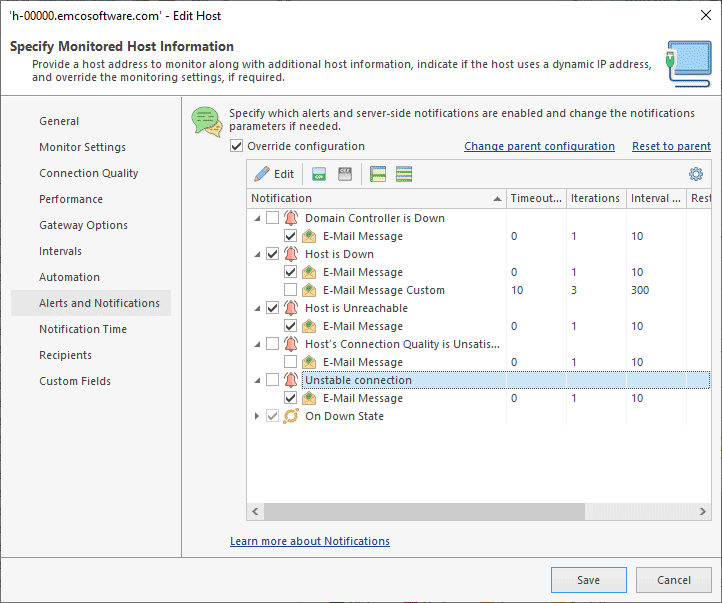
Alerts and Notifications Management
You can configure alerts to be reported when connection state, quality or other host monitoring parameters meet the specified criteria. You can create as many alerts as you need with custom criteria. The program can send e-mail notifications, execute custom actions, show Windows Tray balloons and play sounds when alerts are started and stopped or when host state/quality are changed. You can configure notifications according to your needs. It is also possible to use common settings for all the hosts or individual settings for a specific host/group.
Reporting Features
The program can generate and send reports on a regular basis. Reports include statistics for the selected hosts. It is possible to generate reports in PDF and HTML formats and send them by e-mail to specified e-mail addresses. You can use filters to include only important data into reports. For example, it is possible to filter hosts that didn't have outages during the reporting period.
Monitoring Web Interface
Using the monitoring web interface, you can work with the program via a browser without running a GUI client. The web interface provides access to all the monitoring statistics and allows starting and stopping monitoring for hosts and groups.
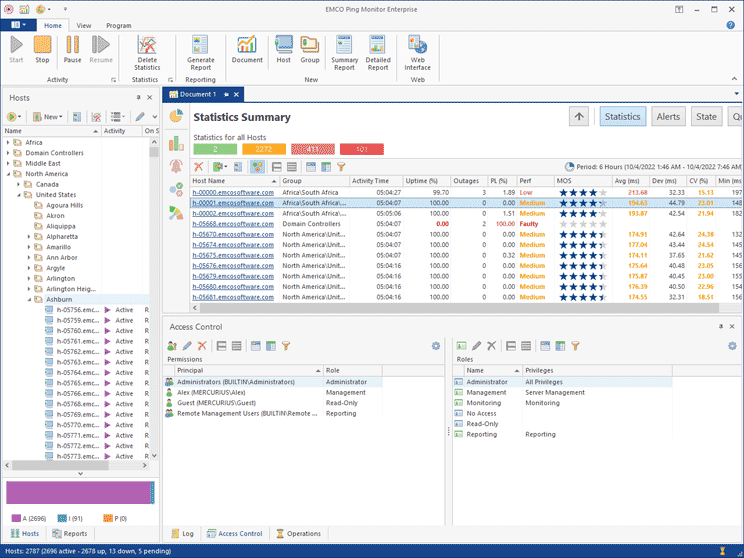
User Access Management
In the Enterprise edition of the program, you can configure a list of Windows accounts that can work with the program. You can configure different roles with different sets of permissions for selected Windows users and groups in the program.
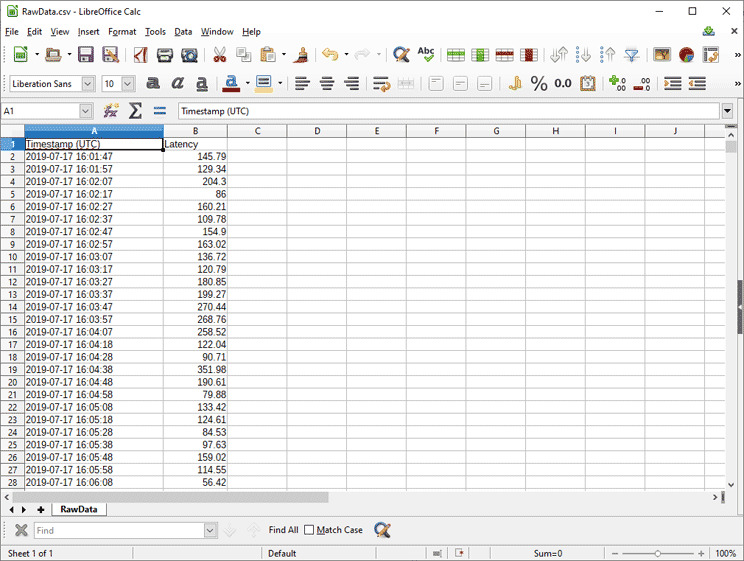
Exported Raw Ping Data
The program allows exporting raw ping data for any host. You can select the required time range and export ping data into a CSV file, which can be opened in an external tool.