Analyzing Execution Results
The main purpose of the Execution Results view is to help you understand if the business operation performed on remote Machines has succeeded and troubleshoot eventual problems. Each entry in the Execution Results view has a severity icon, a title, a description and possibly a hint on solving the problem, if any. From the title, you can understand which operation has been performed; the description contains the result message; the hint provides you with troubleshooting advice; and the severity icon helps you to quickly understand if the task has fully succeeded.
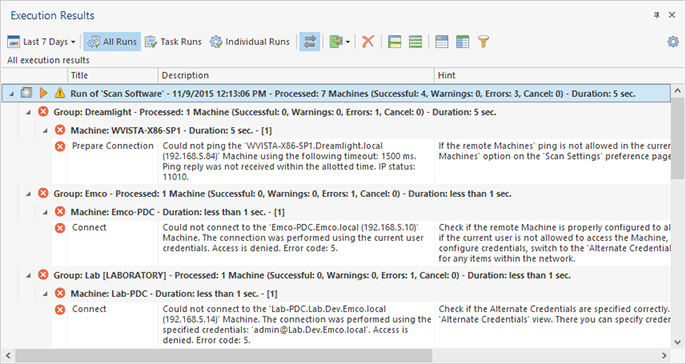
For example, let us take a closer look at the following result set in the Execution Results view Pic 1.
As we can see from the picture above, most of the Machines have been processed successfully, but some of them have not. We need to find out what caused the problem and what should be done to avoid it in future. Also, it may be interesting to go through the warnings to see if anything wrong is going on.
The results are grouped by task runs and groups. In each grouping node, you can see the time during which the elements from that group were processed and the number of successful results, warnings and errors. So, you can basically go through the grouping rows to see if everything is OK and know the time spent for processing.
The error messages displayed in the Execution Results view contain all available information on each error that has occurred. That information is provided to help you understand the problem, try to solve it and avoid it in future.
After the results have been reviewed and all problems have been solved, you can run the operation again and ensure that the problematic Machines are processed successfully this time.
