What's New in Version 9
Here you can see information on the latest releases of the program. Get notifications of new releases. RSS Feed
Version 9.3
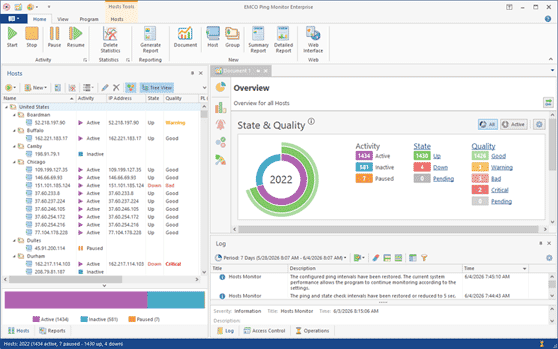
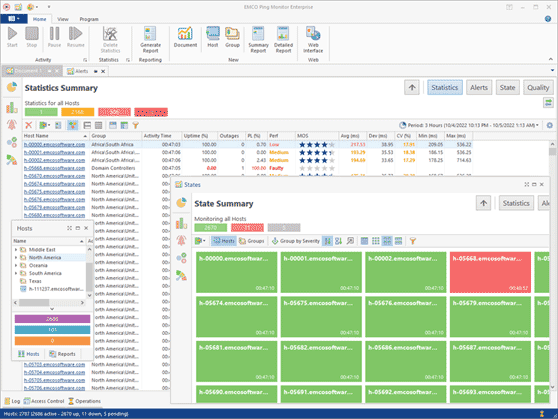
Host state and quality in the Hosts view
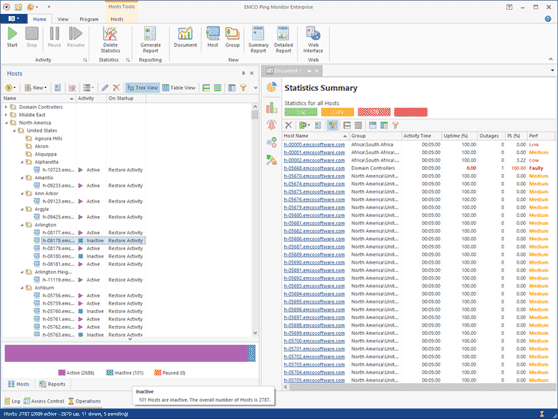
Host State and Quality statuses were added to the Hosts view, allowing you to see all important information in a single table. The view also displays key connection characteristics, such as Packet Loss, Latency, and Jitter.
Resolved issues
- Fixed custom sound notifications for alert resolution events
- Fixed an issue with email headers
- Fixed the Alerts view layout in the Web Interface when the Filters panel is open
- Fixed a potential exception that could occur after restoring the server connection
- Fixed an issue that could cause some hosts and groups to disappear from the Hosts view
- Fixed an exception after resetting statistics filters via a dialog
- Fixed a potential exception during renaming a document tab
- Fixed a potential exception that could occur in the Hosts filter editor when custom fields are enabled
- Fixed a potential exception while browsing hosts quality information
- Fixed text drawing issues in the Hosts tree view
Version 9.2.1
New and improved features
- Added compatibility support for Windows 2025 and Windows 11 version 25H2
Resolved issues
- Fixed a potential crash when closing a document
- Fixed a potential crash when configuring notification settings
Version 9.2
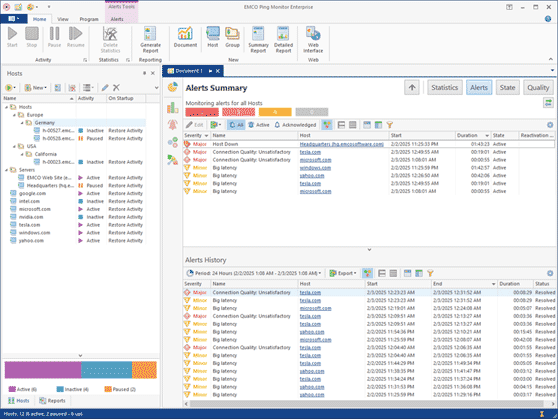
Alerts history for all hosts
Now the Alerts Summary page includes a new Alerts History view that allows tracking of past alerts. This view displays all alerts for all hosts within a selected time period, which can be adjusted as needed. To focus on alerts for a specific host, click on the host name to filter the view accordingly.
New and improved features
- Significant improvement of alerts tracking performance
- Significant improvement of Timeline loading performance
- Improved data loading speed in GUI with multiple opened documents
- Improved mouse navigation in host statistics details
- Improved GUI client appearance on small window sizes
Version 9.1.2
New and improved features
- Compatibility and performance improvements
Resolved issues
- Security fix for CVE-2022-28944 vulnerability
Version 9.1.1
New and improved features
- Improved error handling for available OAuth mail providers
- Improved daylight saving time handling in charts
Resolved issues
- Fixed the Performance chart on the Overview screen
- Fixed incorrect presentation of Statistics charts for daily periods
- Fixed notifications in the application's notification center
- Fixed exceptions related to daylight saving time
- Fixed invalid HTML report layout for machines that don't belong to a group
- Fixed an error if an alert condition uses the IP Address field
Version 9.1
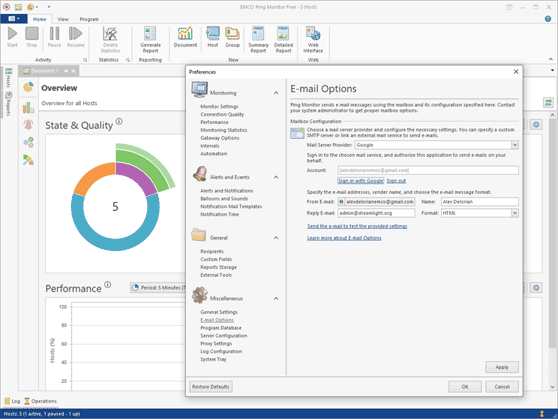
OAuth authentication for mailboxes
The program now offers OAuth authentication for Gmail and Outlook mailboxes used for sending email notifications. In Preferences, you can select either Gmail or Outlook as your mail provider and authorize the use of your mailbox for email notifications. All mail settings are configured automatically. You can change the account or sign out at any time. Traditional SMTP mail server configuration is also supported if you prefer to use it.
Resolved issues
- Fixed switching to the Standard Latency Measurement provider
- Fixed NullReferenceException error reported in some cases
- Fixed an error reported during daylight saving time change
- Fixed a duplicate key error when working with Statistics
Version 9.0.9
New and improved features
- Detailed report configuration improvements
- Performance and Windows compatibility improvements
Version 9.0.8
New and improved features
- Compatibility improvements with the new Windows builds
Resolved issues
- Group email notifications sometimes include messages from previous time periods
Version 9.0.6
New and improved features
- Improved email notification templates
- Improved stability of ping results in some environments
Version 9.0.5
Resolved issues
- UI sometimes crashes on sound and balloon notifications
- Internal Server Error: can't find the Quality property
Version 9.0.3
Resolved issues
- Sometimes a client reconnects to the server while a user is trying to edit host settings
- An error on copy/paste in some cases
Version 9.0.2
Resolved issues
- An error reported when there are other docking windows beside documents in the documents zone
- An exception in the PingMonitor desktop UI under certain conditions when a host state changes
- Time zone handling: Europe/Kiev was officially renamed to Europe/Kyiv
Version 9.0
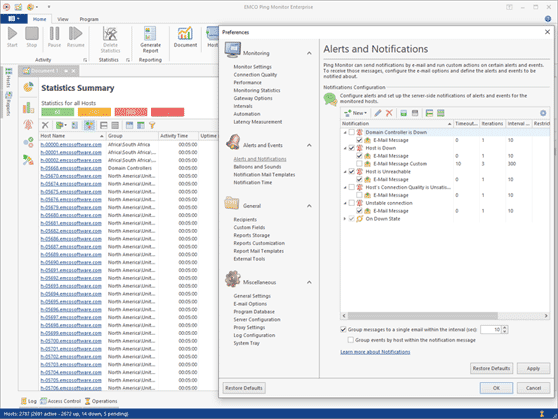
Introducing Alerts
The program introduces alerts that help you to discover current problems with monitored host. You can configure as many alerts in the program as you need. Each alert uses a custom condition based on real-time host monitoring characteristics, so once the condition is satisfied for a monitored host, the program reports an alert for that host. The program displays a total number of current alerts in Overview and also displays a list of alerts in Alerts Summary, so you can see all detected problems for monitored hosts. You can acknowledge alerts for the selected period while working on resolving the problem. A list of acknowledged and active alerts can be reviewed separately to help you navigating through the current monitoring problems.
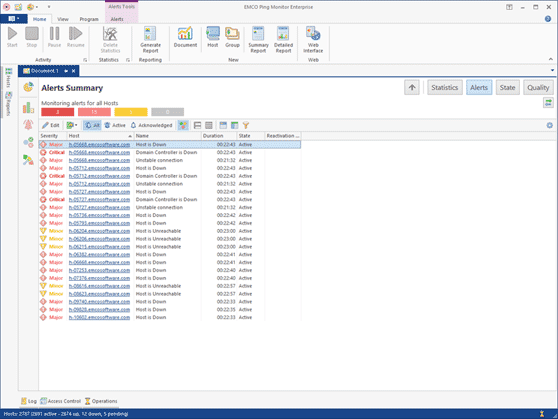
Managing Alerts and Notifications
The program allows you to configure alerts in the program preferences. The program provides predefined alerts that are reported when host states are changed to Down or connection quality is changed to Bad or Critical, but you can create custom alerts. You can use any real-time monitoring characteristics in the alert condition, including host state, quality, packet loss, latency, jitter, etc. The program can send notifications and execute custom actions when alerts are started and ended. You can assign notifications and custom actions to alerts and host state/quality change events and configure notification settings.
Document Interface
The program introduces document-based interface. Now all monitoring data are represented in a document, you can navigate through it to see specific monitoring characteristics, such as Alerts, Hosts Statistics, Hosts State and Hosts Quality. Each document works with its own set of hosts, so you can open multiple documents represented different host. Each document has its own navigation and UI settings, so you can use different data filtering, grouping and sorting settings in different documents. You can create custom layout to organize multiple documents on the screen according with your needs.
Program Navigation Improvements
The program now provides improved navigation, so you can quickly switch between screens representing different data. Now all monitored data are represented in the document interface. You can use the navigation bar to open different pages representing information about all hosts, such as Overview, Statistics Summary, Alerts Summary, State Summary and Quality Summary. You can also drill-down to the host level and review hosts statistics, alerts, state and quality. All monitoring information about all hosts and for a single host is available in the same document view.
New Overview Screen
Overview now displays additional information, including host performance statistics for a specific period, so you can see on the chart how performance of the monitored hosts changed over time. You can also see an interactive chart with alerts, so you can see how many alerts are currently active and acknowledged.
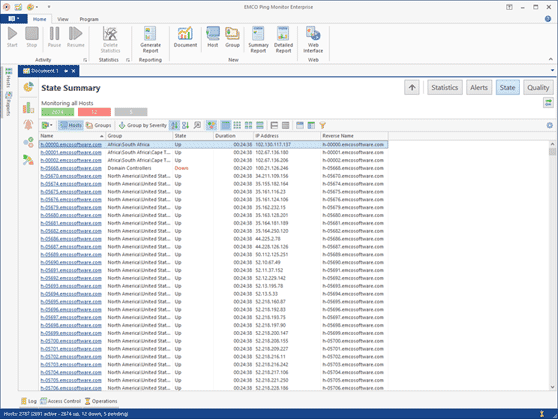
State/Quality Data Representation as a Table
The new table format of data representation is available for State Summary and Quality Summary. It allows representing the information about the current hosts state/quality as a table, where each host is represented as a table row and monitoring metrics are represented as the table columns. You can use data sorting, grouping and filtering options to organize the table data.
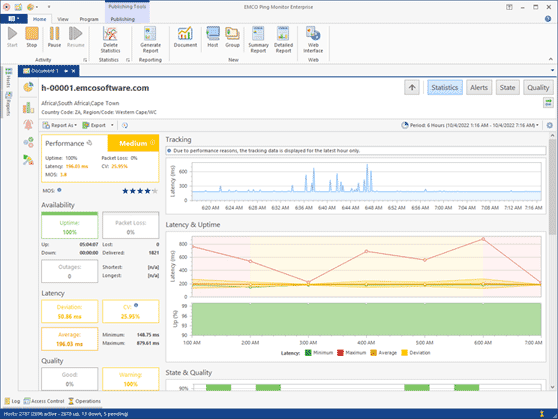
Improved Host Statistics
Now all hosts statistics collected for a host is represented on a single screen the displays host performance, availability, latency, quality metrics as well as the chart displaying real-time ping tracking and other charts representing latency and uptime, state and data for a selected period. You can also find host state and quality intervals and host events on the same screen. You don't need to switch to the different views to see all these data. Now they are represented on the single screen.
Activity Chart in the Hosts View
At the bottom of the Hosts view you can find a chart representing hosts activity, so you can see how many hosts are monitored, paused or not monitored. The chart is interactive, so you can click specific activity valued to apply a filter and display those hosts in the view.
Custom Fields Improvements
Now you can specify default values for custom fields in the program preferences, if required, and override them on for a host or for a group. You can display host values in the Hosts view and apply data sorting, grouping and filtering using custom fields values. To display custom fields you can use a column chooser for the hosts table.
Overriding Global Settings
You can override settings provided in the program preferences for a group or for a host. The program allows you to override alerts and notification settings, so you can enable and disable alerts and notifications for a host or for a group. You can also override e-mail recipients and notification activation time to configure custom schedule for a host or for a group.