What's New in Version 5
Here you can see information on the latest releases of the program. Get notifications of new releases. RSS Feed
Version 5.2.9
Resolved issues
- Invalid file system characters in report name prevent a report from being saved to a storage
- Wrong layout of the Host Details view when the host information is expanded
- The client exits with fatal error when the custom sound preview fails
- A path on CD, DVD or RAM disk is not treated as an absolute local path
- The report file name template editor contains ellipses button that performs no action
Version 5.2.8
Resolved issues
- Editing a Group in parallel with hosts creating process may lead to the inconsistent state of the program database, which leads to critical errors when starting and running the program
- A critical error occurs when closing the program with the Log view in a floating state
- The events in the Log view may be grouped incorrectly
Version 5.2.7
Resolved issues
- Compatibility issue with the Reliability Rollup for Microsoft .NET Framework 4.5.2 update
Version 5.2.6
New and improved features
- Significantly improved events and statistics logging performance
Resolved issues
- Possible dead lock when switching between hosts when the monitoring statistics entries are being saved or deleted from the database
- The memory consumption is continuously growing when the program is minimized and the selected host is offline
Version 5.2.2
Windows service
The Professional edition of the program runs a Windows service, allowing to monitor hosts and generate regular reports with no logged-on user session required. When you close UI or log off from Windows, all active and scheduled operations continue to work.
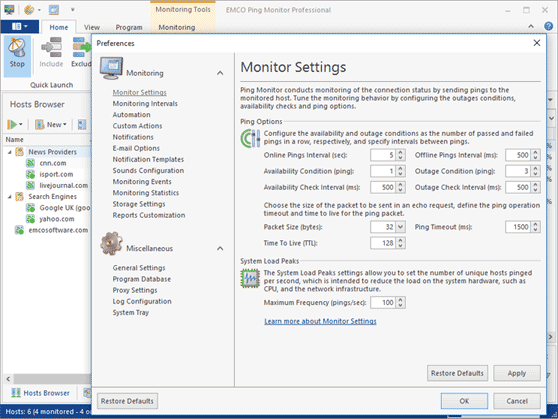
New ping interval settings
Using the new settings in Preferences you can specify different failed ping intervals for outage detection and offline pings. When a monitored host is offline, the program makes pings with the interval defined by the Offline Pings Interval parameter. When a host is online, but pings are started to fail, the program sends pings with the interval defined by the Outage Check Interval until Outage Condition will be reached and an outage will be detected.
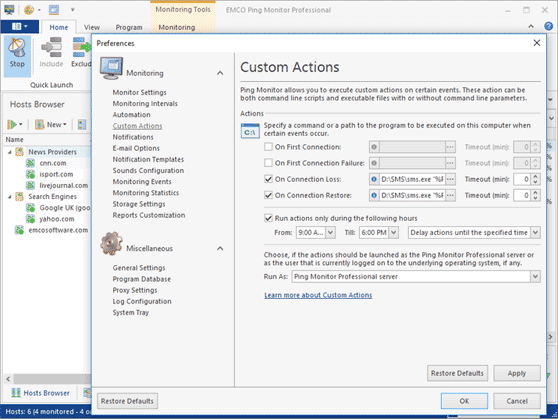
New options for custom actions
To configure custom actions you can select an account used to run them in the Professional edition of the program. You can run actions as a current user or Ping Monitor server.
New and improved features
- When the host is not monitored (the monitoring process is either stopped or paused) the newly None state is used for this host
- The Quick Launch option is taken into account when performing hosts import/export and copying hosts via drag and drop or clipboard
- Using the Indeterminate host status instead of the Unstable one after launching the monitoring process if the pings are successful but the availability condition has not been reached yet
- Improved the ping intervals calculation accuracy
- Improved host states decoration in the Hosts Browser view
Resolved issues
- If the pause time is longer than the live chart display interval, no state is displayed on the bottom part of the chart
- The On Connection Loss automation condition for pause is incorrectly treated when the host is still unavailable after the pause ends
- SMTP server authentication issue when sending notification e-mails
Version 5.1.2
Resolved issues
- Potential failure during the program database update when the Microsoft SQL Server database is used
- A summary report e-mail message is not generated due to the formatting error when the Plain Text format is used for e-mails
Version 5.1
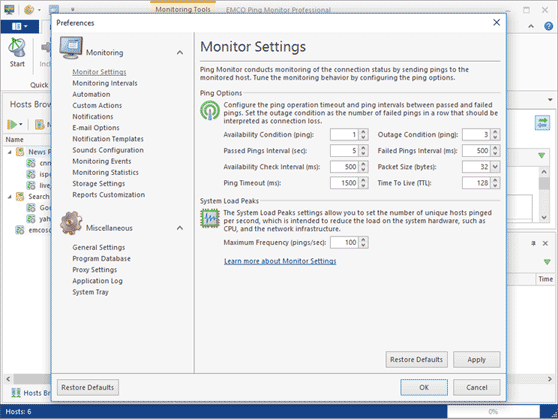
Connection establishment connection
The new Availability Condition parameter, available in Preferences, allows you to define the number of passed pings in a row that could be interpreted as established connection to a remote host. By default that parameter is set to one ping, so the end of outage will be detected once the first ping is passed, but you can change this parameter if you need during the initial configuration of the program or later in the Preferences dialog.
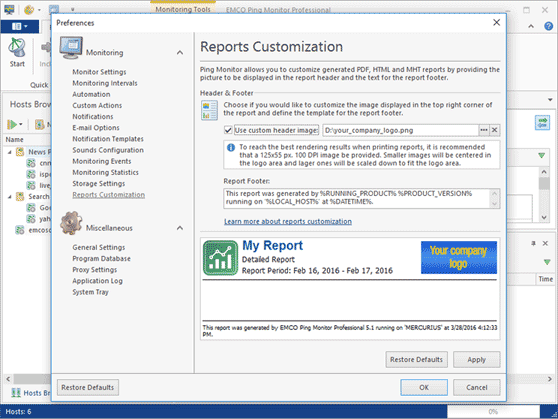
Customizable headers and footers in reports
In the Professional edition of the program, you can customize the report headers and footers to display custom text and a company logo. You can use the available customization options in the Preferences > Reports Customization dialog.
New and improved features
- Added the option to overriding common report output settings in the immediate report generation wizard
- Added the option to delete monitoring events when deleting host statistics
- Increased precision of uptime and downtime percentage calculation
- The outages count column is added to the summary report
- The uptime and downtime interval columns are added to the views displaying hosts
Resolved issues
- Proxy settings are ignored when uploading reports to the specified FTP server
- The On Outages Limit automation condition does not work properly
- All monitoring events are deleted on the program startup when it is configured to delete events manually
- Potential errors when refreshing the Historical Data view if storing of the historical data is disabled in the program preferences
Version 5.0.1
New and improved features
- Introduces the options to copy and export the connection outages information from the Details view
- Introduces auto-scrolling of the outages list in the Details view
Resolved issues
- A new group is created for each host while importing grouped hosts from CSV files
- It is impossible to sort by the IP Address column in the Hosts view
- For multiple iterations of connection status notifications, the interval between notifications is ignored when specific conditions are reached
- The Groups from report members are exported incompletely when exporting reports
Version 5.0
Brand-new user interface
The application interface is completely reworked to introduce the new views that allow you to access the new features of the application. Using the new views, you can manage hosts and organize them in groups, check the host status and see all outages for the host, review the connection uptime and ping statistics on charts, manage and review the automatically generated reports. You can change the default UI layout and organize to views according to your needs.
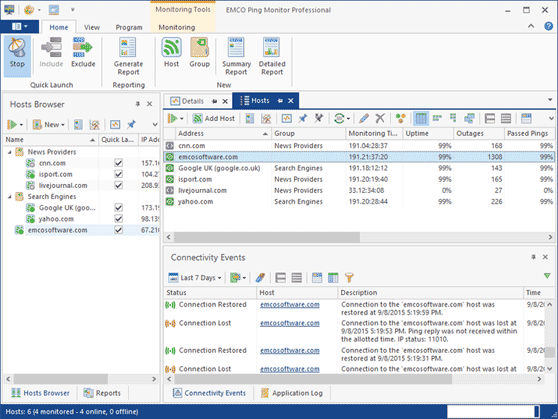
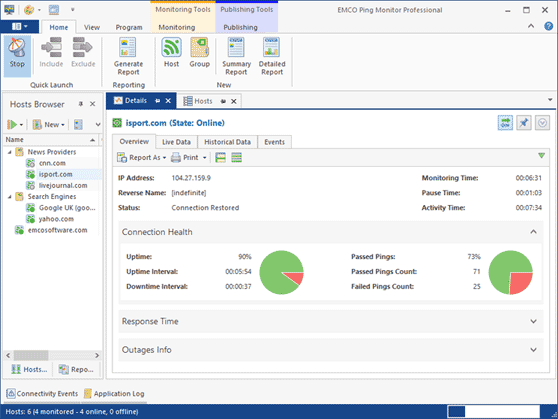
Detailed host status info
Now you can get detailed information on the host status and monitoring statistics via the Overview tab of the Details view. There you can see the current host status, the connection health and ping response time statistics and the list of detected outages for the selected host.
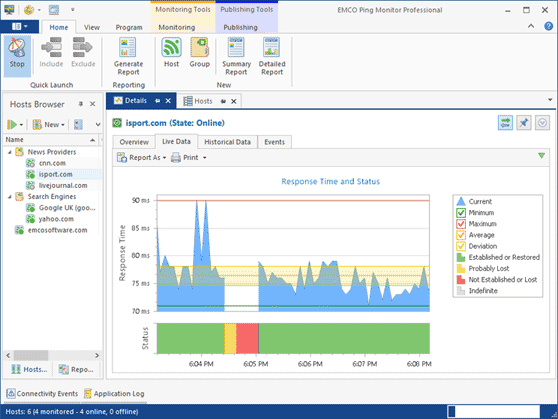
Live and historical data charts
The application allows seeing connection statistics on the charts. The charts displayed in the Live Data tab of the Details view show real-time ping and connection status data, so you can use it to see how a selected connection works right now. If you would like to see aggregated statistics for previous periods, you can switch to the Historical Data tab to see the ping response time and uptime statistics on charts.
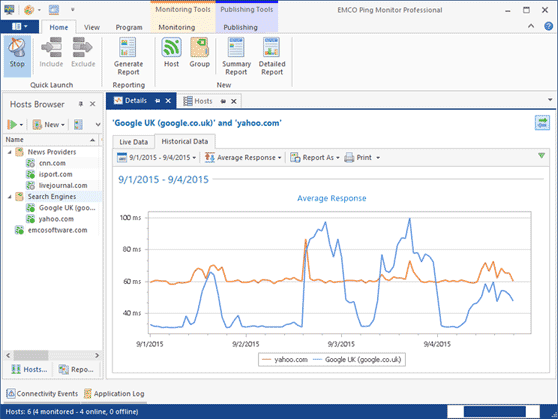
Compare connections performance
You can compare the uptime and ping statistics of multiple hosts displayed on the same chart. To use this feature, you need to select multiple hosts or a group of hosts and open the Details view.
Hosts grouping
If you work with different types of hosts, you can organize them in groups. Using the Professional edition of the application, you can use custom settings for a group of hosts overriding the global settings. For example, you can use a custom e-mail notification recipients list or specific custom actions for a group. Besides, you can create a report for a group of hosts, so if you change the hosts in the group later, the generated reports will be updated automatically to include information on the actual list of hosts in the group.
Automatic reports
The application can now automatically generate reports that provide connection-monitoring statistics. You can create reports in the Reports view. For every report, you need to specify a list of hosts to be included into the report, the report output format and the report recurrence options. You can create a simple report that includes only general statistics for the included hosts or a detailed report that displays the hosts statistics for the reported period as charts. Reports can be generated in the HTML and PDF formats and saved to a folder or sent by e-mail on a regular basis according to the selected recurrence options.
Uploading reports to a web server
If you use the Professional edition of the application and have a web server, you can configure the application to upload generated HTML reports to the web server by FTP or FTPS, so you can browse the reports through the web.