What's New in Version 7
Here you can see information on the latest releases of the program. Get notifications of new releases. RSS Feed
Version 7.3.2
Resolved issues
- A possible UI crash upon addition of a user or group in Access Control View on a host system with accessibility options activated
Version 7.3.1
New and improved features
- Reduced CPU consumption
- Line breaks are preserved in the host's description when sending e-mail notifications
Resolved issues
- Hanging of the desktop application on the Host Statistics view under certain conditions
- Hosts monitoring stops due to exceptions thrown while monitoring under heavy CPU load
- Possible deadlock on logging
- Possible memory leak in dialog forms
- Possible user interface crash when updating data in forms
Version 7.2.1
New and improved features
- Added an option that allows selecting principals from all domains in the forest and the trusted domains
Resolved issues
- A potential memory leak in the service when raw data collecting is enabled
- A crash on update when connecting to a remote server
- Duplicating of principal names with different SIDs
Version 7.1.2
New and improved features
- Increased maximum allowed command size when specifying custom actions
Resolved issues
- The link for excluding missing items from filter on the web interface does not work in specific circumstances
- Possible error when loading objects on program startup
Version 7.1
Response latency tracking
The response latency along with state and quality changes tracking is included to the host statistics for live intervals.
New and improved features
- Significantly improved responsiveness of the program web interface
Resolved issues
- The program fails to import database from version 6 in case it can be no longer launched
- Possible application failure due to critical error when selecting auto-filter row in the Hosts tree view
Version 7.0.8
Resolved issues
- The web interface in the Enterprise edition cannot be launched on IIS server version less than 10.0
- The charts are failing to load leading to the fatal error in the program when the client time zone has fractional UTC offset
Version 7.0.7
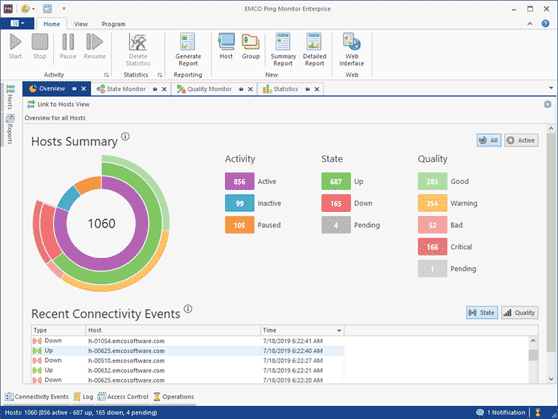
System state overview
There is a new view in the program that provides you with an overview of the current state of the monitored hosts. There you can see the number of the monitored, non-monitored and paused hosts. The same view shows the total number of the monitored hosts in different states (Up and Down) and with a different connection quality (Good, Warning, Bad and Critical). All numbers are clickable, so you can navigate to the hosts with the selected Activity, State or Quality.
Connection quality tracking
In addition to the host state monitoring, the program can now monitor the connection quality for the monitored hosts, so you can see it on screen and get notifications when the connection quality changes. The connection quality is determined using the packet loss, latency percentile and jitter metrics to show the quality as Good, Warning, Bad or Critical.
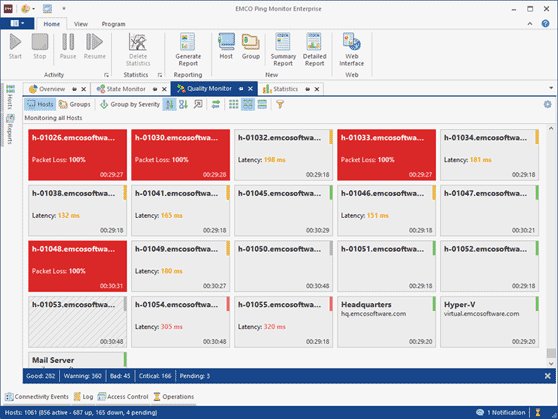
State and quality monitors
Using the State and Quality Monitors, which are available in the Enterprise edition of the program, you can see the states and the connection quality of all the monitored hosts on a single screen. Those views are designed for control rooms where the monitored hosts should be represented in a compact form while their state and quality are displayed by means of different colors. It is possible to sort and filter the displayed data to show hosts with the required characteristics only.
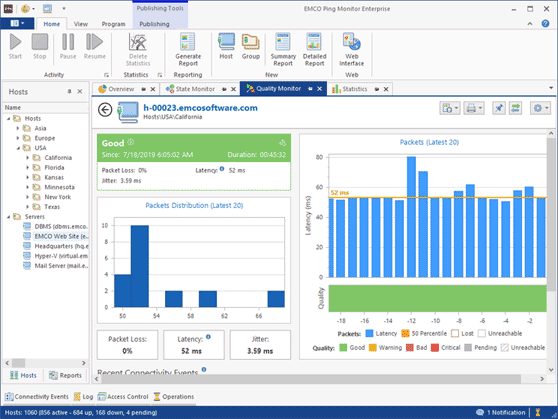
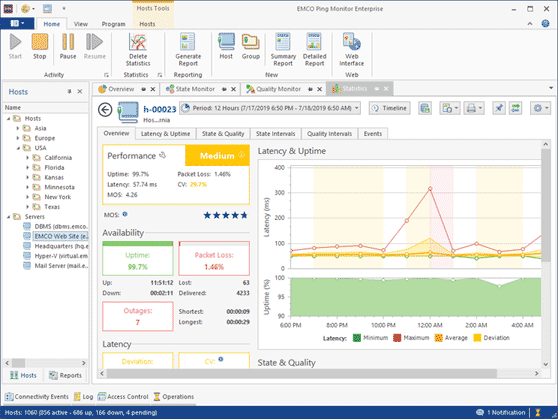
Determining the host performance and displaying statistics for a selected period
You can select the required period and get information on the host performance and statistics for the selected period. The host performance is determined using the uptime, packet loss, latency, CV, MOS and other metrics. The collected metrics are displayed in charts where you can see how they change over time. You can also get information about the number of outages and the periods when the host was in a different state or had varying quality characteristics during a selected period.
Improved monitoring web interface
The web interface, which is available in the Enterprise edition of the program, has been significantly improved. It now allows seeing all monitoring data and statistics though the web without opening a GUI client. The new web interface allows starting and stopping monitoring for hosts and groups.
Improved notifications
In addition to the host state notifications, now it is possible to send notifications when the connection quality changes. You can configure multiple notifications for every event in the updated notification settings dialog in Preferences. For example, you can send e-mail notifications and execute custom actions such as Windows commands, scripts or executables. To reduce the number of notifications, it is possible to group messages into one e-mail within a specified time interval, or group multiple events into one e-mail for every host.
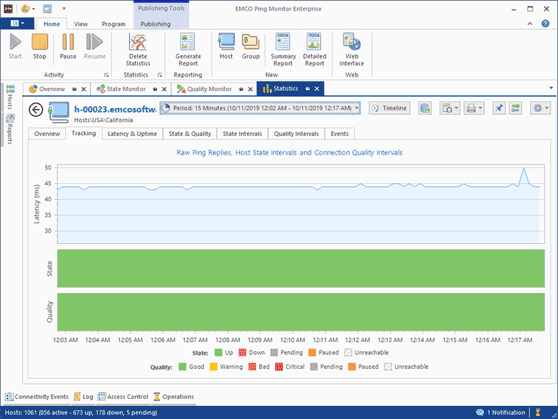
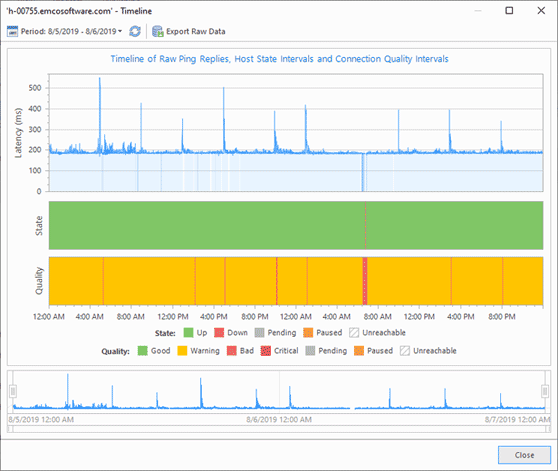
Host timeline and raw ping data exporting
Using the new Timeline view, you can see raw ping replies for a selected period and the host state and quality for the same period. That data is displayed on charts, so you can see how they change over time. If you wish, you can export raw ping data into a CSV file and open it in an external program.
Hosts filtering in reports
The reports configuration now includes a filter that can be used to filter report host members. You may specify that the report should only include the hosts that meet the condition.