Log View
The log is designed to store information on the events taking place during the program execution. The larger part of this information consists of events generated by the operations. The purpose of this chapter is to help you understand the log.
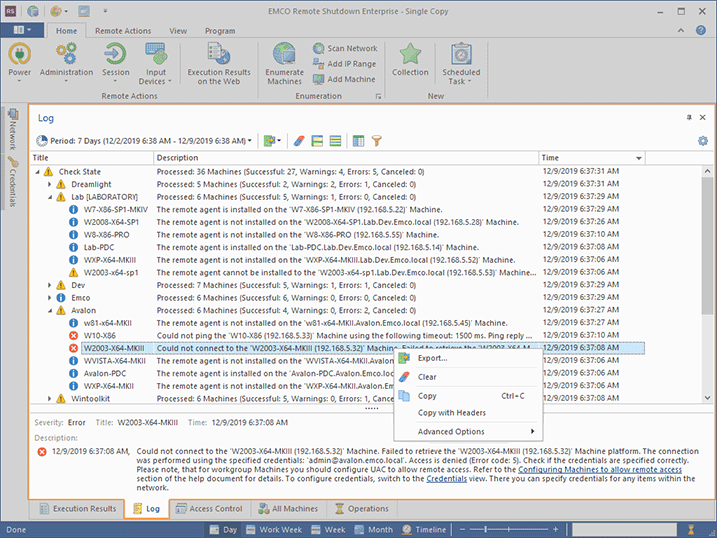
The Log view is located by default at the bottom of the Remote Shutdown main window and displays the log in form of a tree and a pane that shows details of a selected event Pic 1. The description for any logged event is by default wrapped, so that you can easily read it. If you would like to have more events visible at the same time, you can configure the Log view to display only one line per event by disabling the Wrap Description option from the Advanced Options menu, after which a detailed description will only be shown in the event details pane. If you do not need the event details pane and would like to review the events only within the tree, you can hide the event details pane by disabling the Show Event Details Pane option from the Advanced Options menu. Also, it is possible to enable the automatic scrolling feature to always see new log events as soon as they arrive, using the Autoscroll item from the Advanced Options menu.
The logged events are selected only for the specified period. This approach is used to optimize memory usage and performance as there may be lots of events in the entire database. The display range for events is by default set to the 7 Days value and can be changed with the range drop-down button on the view toolbar. The text on the button shows you the currently applied range. You can choose between the predefined ranges or provide a custom one.
Every event in the log is assigned a severity level represented by a certain icon. The icon allows you to see if any problem has occurred without reading the description. The following icons are available:
|
- |
the blue icon with an 'i' character means that everything is OK; |
|
- |
the brown circle icon with a cross-cut line is used to identify that the operation was canceled by user or due to shutdown of the underlying system; |
|
- |
the yellow icon with an exclamation mark is the warning sign: it tells you that some errors have occurred, but they are not critical. In such a case, there is no guarantee that the operation has actually succeeded; |
|
- |
the red icon with a white cross is the error sign: it means that the operation execution has failed. |
Analyzing the log can help you a lot in your everyday work with Remote Shutdown, because it contains all the information on the executed tasks and provides you with troubleshooting recommendations in case any problems are detected.
Toolbar Overview
|
Period The Period button from the Log view toolbar allows you to choose the time interval to display the logged events for. |
|
Export The Export button should be used to export the log to a CSV file. |
|
Clear The Clear button should be used to delete all the logged events from the program database. |
|
Full Expand The Full Expand button from the Log view toolbar should be used to expand all nodes in the table of logged events. |
|
Full Collapse The Full Collapse button from the Log view toolbar should be used to collapse all nodes in the table of logged events. |
|
Choose Columns The Choose Columns button should be used to choose the columns to be displayed in the table of logged events. |
|
Filter Editor The Filter Editor button should be used to define the custom filter criteria to be applied to the data displayed within the table of logged events. |
|
Advanced Options The Advanced Options button enables you to configure the Log view, manage the visibility of the event details pane and reset the view layout. |
The options of clearing the log, expanding nodes in the tree of logged events and collapsing them are also available from the pop-up menu of the Log view.
The layout of the Log view, including the visible columns, the column widths, the sorting settings, the descriptions wrapping and the details pane visibility, can be easily reset to the initial defaults by choosing the Reset Layout option from the view menu.


