Program Interface Overview
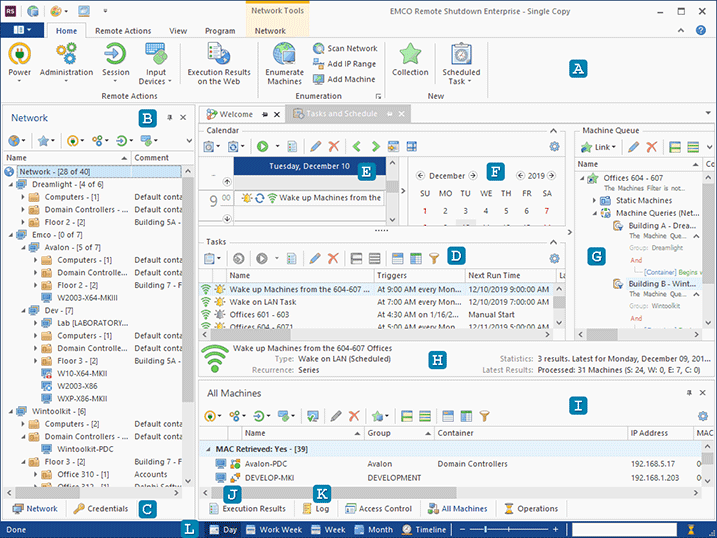
Let's take a look at the program's main window to become familiar with the user interface. In the middle of the program's main window you can find the Welcome Screen and Tasks and Schedule views. The Task and Schedule view has several functionality areas Pic 1.
At the top of the main screen, you can find the Ribbon bar A that provides access to the main program actions. It consists of four static pages together with several contextual pages, and you can switch between them to get access to different groups of actions.
The program is designed to work with remote PCs in the network. The hierarchical network structure is represented in the Network view B located on the left of the main screen. It shows the available domains, workgroups, organization units and PCs. If you need to easily manage PCs that belong to different organization units or workgroups/domains, you can put them into Collections inside the Collections node. It allows you to regroup PCs according to your needs and launch group operations with a single click. The tabs at the bottom C are used to switch between the Network view, which displays the network structure, and the Credentials view, which is intended to set up different credentials to access different network groups and PCs.
All tasks are shown in the Tasks area D and the scheduled tasks are also present in the Scheduling area E. The latter displays past and future tasks on the calendar according to their execution date and time. You can switch between dates using the Date Navigator F pane located on the right. Also, you can scale and zoom the presentation area to display daily, weekly or monthly views and the timeline using the control bar at the bottom L.
To manage tasks, you can select them in the Tasks area or the Scheduling area. When selecting a task, you can see a list of Collections describing a set of Machines where it will be executed on the Machine Queue pane G. If required, you can add or remove Collections using the actions available on the pane's toolbar. Detailed information about the selected task is available on the Task Details pane H. There, you can see the common task information and the task execution statistics. Information about the MAC addresses retrieved for the Machines is gathered within the All Machines view I. Detailed results of each business operation over remote Machines are displayed in the Execution Results view J. If you need the information about supplementary operations results and events taking place while running the program, you can find it in the Log view K. In case of any errors, you should check the Execution Results and Log views because they contain important troubleshooting information.
What's Inside
