Program Interface Overview
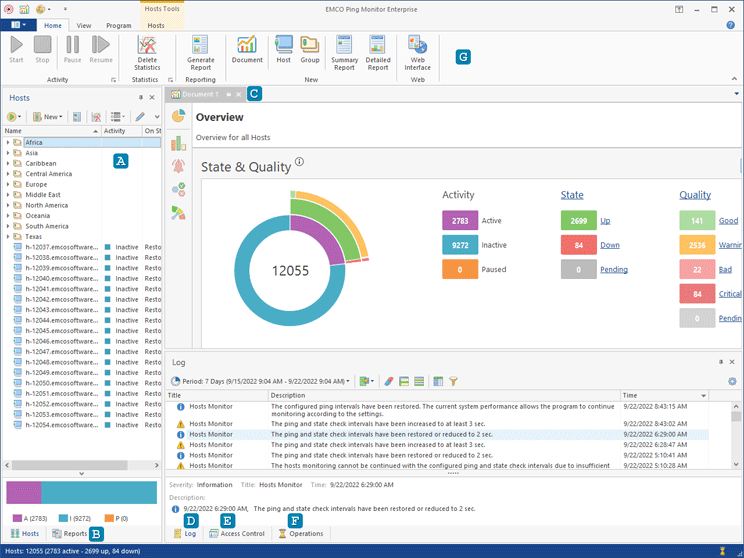
The main window of Ping Monitor Pic 1 displays the Hosts view A, the Reports view B, the Document view C, the Log view D, the Access Control view E, the Operations view F and the Ribbon bar G.
The Hosts view displays the hosts and groups of hosts in the hierarchical structure and is primarily designed for performing hosts management and monitoring activity management. The Reports view is designed to display and manage preconfigured monitors performance and availability reports to be generated either on demand or on a regular basis.
The Log view shows those events not connected to hosts availability and monitoring activity, such as messages from supplementary operations, reports generation problems, etc. Within the Access Control view, you can define the roles and permissions for the users to access the server. If you would like to review and/or cancel the currently running operations, you can use the Operations view.
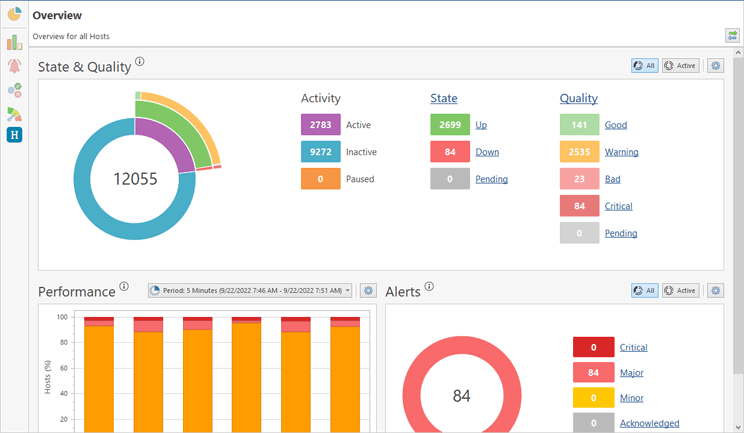
The Document view provides you with access to host monitoring information and statistics Pic 2. You can open multiple documents, if required, to display monitoring information for different hosts. On the left side of the document you can find the navigation panel H that allows you to switch the pages in the document to work with the different types of the data.
Use the navigation panel to work with the following pages. Overview provides you with the brief information on the hosts being monitored and their actual state and quality. Statistics Summary displays the hosts monitoring statistics for the specified time interval. Alerts Summary displays alerts for hosts. You can review all active alerts, alerts history for all hosts and can acknowledge alerts, if you need. State Summary can be used to monitor current state of remote hosts. Quality Summary allows you to focus on the connection quality to the hosts.
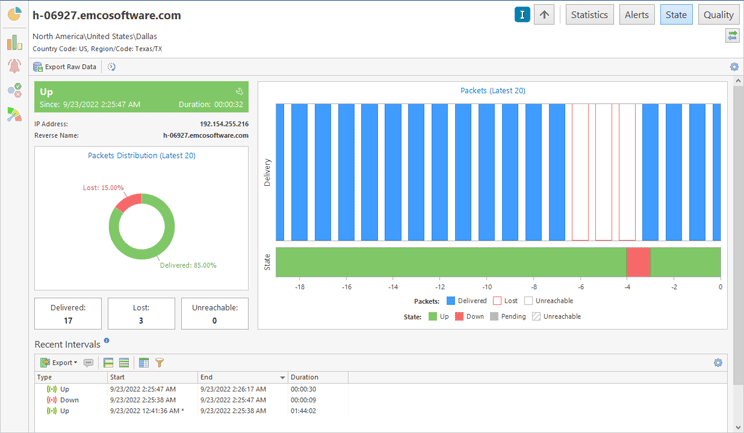
The summary pages allow you to review statistics, alerts, state and quality for multiple hosts at once, but to get details for a specific host, you can click the host name and drill-down to this host to review its characteristics Pic 3. You can switch between host characteristics using buttons, located on the navigation bar I.
Use the Up button to navigate to the upper level. You can switch between host monitoring data pages using Statistics, Alerts, State and Quality buttons.
What's Inside


