Alerts Page
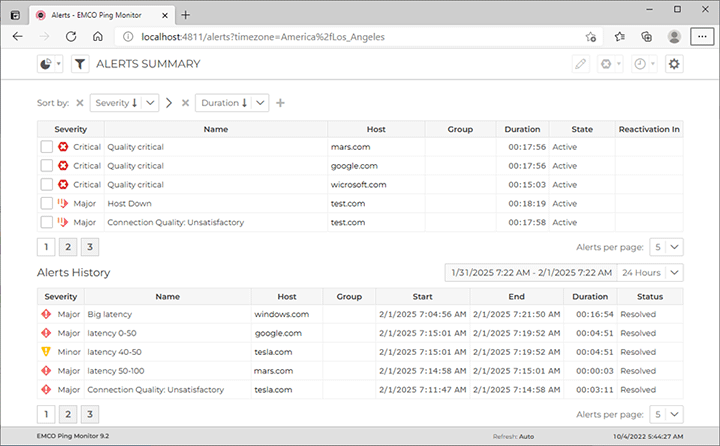
The Alerts page is designed to display information about detected alerts. This page contains two views. The top view shows active alerts currently reported for monitored hosts. The bottom view displays the Alerts History, listing alerts detected earlier. You can adjust the scope of displayed alerts history by selecting a specific time period.
Each row in both views represents an alert, while columns display alert details such as the alert name, host name, duration of the alert and its severity Pic 1.
The alerts lists can be sorted by one or multiple fields. You can edit an active alert by selecting it and clicking the Edit button on the toolbar. This allows you to modify the alert's severity and acknowledge it either for a specific time interval or indefinitely. You can also filter the displayed alerts to show only active or acknowledged alerts.
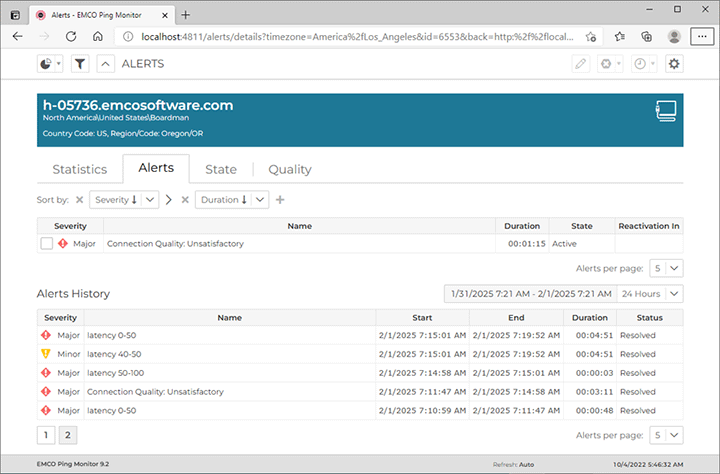
The Alerts page displays alerts for all hosts, but you can click a host name in the table to drill-down to the host level and review alerts for the selected host Pic 2. The alerts list for a host is similar to the list of alerts for all hosts, but it displays alerts for the selected host only.

