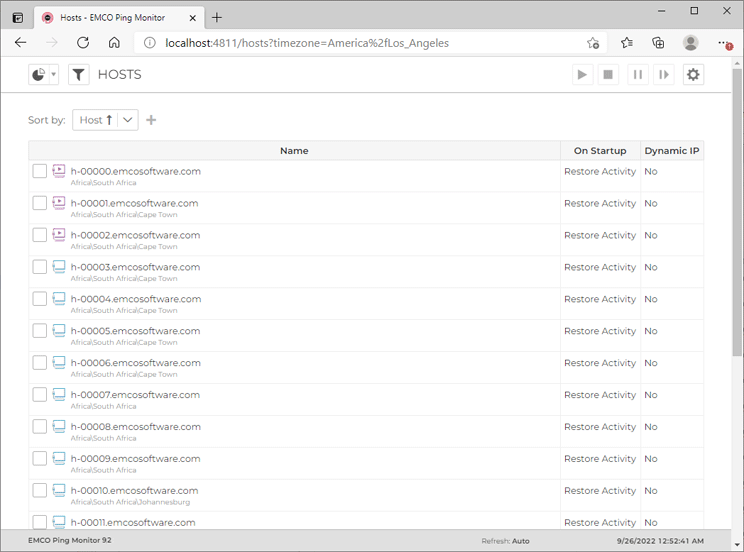
Hosts Page
The Hosts page Pic 1 was primarily designed for performing monitoring activity management as well as host state and connection quality monitoring. It can displays hosts available in the program split into pages.
On the Hosts page you can find the current monitoring activity for each host. For all hosts the monitoring is currently active, you can see its state and connection quality, as well as the connection quality characteristics. The host state, connection quality and the characteristics used for quality calculation are underlined with the severity color.
You can configure the Hosts page to show information only for specific hosts and/or groups using the filter editor that is reached using the Filter button next to the navigation menu in the left top corner of the page. Using the filter editor, you can also filter the page by monitoring activity, hosts state and connection quality. The refresh interval is configured within the Advanced Options drop-down button from the right top corner.
|
Start The Start button from the Hosts page header can be used to start the monitoring process for the checked hosts. |
|
Stop The Stop button from the Hosts page header allows you to stop the monitoring process for the checked hosts. |
|
Pause The Pause button from the Hosts page header can be used to pause the monitoring process for the checked hosts. |
|
Resume The Resume button from the Hosts view toolbar is used to resume the monitoring process for the checked hosts. |
|
List The List button from the Hosts page toolbar switches the page to the list representation of hosts providing you with maximum details. |
|
Table The Table button from the Hosts page toolbar switches the page to the compact table representation of hosts. |
To control the monitoring activity, check the hosts in the view and use the Start, Stop, Pause and Resume buttons from the page header. It is possible to switch between the list and table representations of hosts using the List and Table items on the toolbar and in the popup menu. These representations provide different level of detail.


