Overview Page
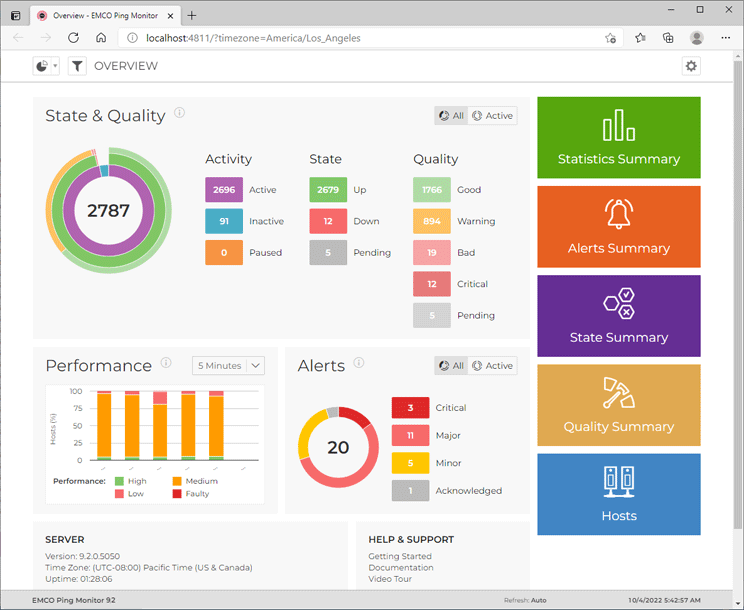
The Overview Pic 1 page is designed to provide you with the brief information on monitored hosts and their states. It is the home page of the Ping Monitor web interface. You can either overview the entire monitoring system or focus on specific host and/or groups.
In the State & Quality area of the Overview page the information is summarized in a doughnut chart, so you can easily see the distribution of hosts with different state and quality. Inside a doughnut itself, you can find the total number of hosts you are focusing. The first column of the legend displays the count of active, inactive and paused hosts – this distribution is represented with the inner doughnut.
For the hosts the monitoring is active for, you can find the information on how many of them are Up and Down. This distribution is displayed in the second column of the legend and the middle doughnut respectively. The last column is used to describe the connection quality to monitored hosts. The distribution is reflected in the outer doughnut on the chart. You can focus on host states and connection quality distribution for active hosts by clicking on the Active radio button in the right top corner of the area. To switch back to all hosts use the All button.
The State & Quality and other parts of the Overview page are interactive. For example, you can click the values for the activities and/or states and qualities to drill down to the hosts with the corresponding activity, quality and state.
The Performance area shows a chart with distribution of the total number of hosts with the different performance characteristics over time. You can select a period of time and see how many hosts had High, Medium, Low and Faulty performance in specific periods.
The Alerts area displays a chart that shows the number of active alerts at the current moment. Alerts are displayed by severity, so you can see the number of alerts with each severity. You can click these numbers to go to the Alerts page where the alerts with the selected severity are displayed.
You can configure the Overview page to show information only for specific hosts and/or groups using the filter editor that is reached using the Filter button next to the navigation menu in the left top corner of the page. The refresh interval is configured within the Advanced Options drop-down button from the right top corner.
In the bottom part of the Overview page, you can find the information on the server and a set of helpful links. You can use the colored buttons, located either to the left or on the top of the information areas depending on the pages size, to navigate to other pages. The hosts filter is pertained during the navigation.
