Alerts
The Alerts page of a document displays the active alerts for monitored hosts and alerts history. You can open it by clicking the Alerts Summary button on the navigation panel of the document.
Alerts Summary
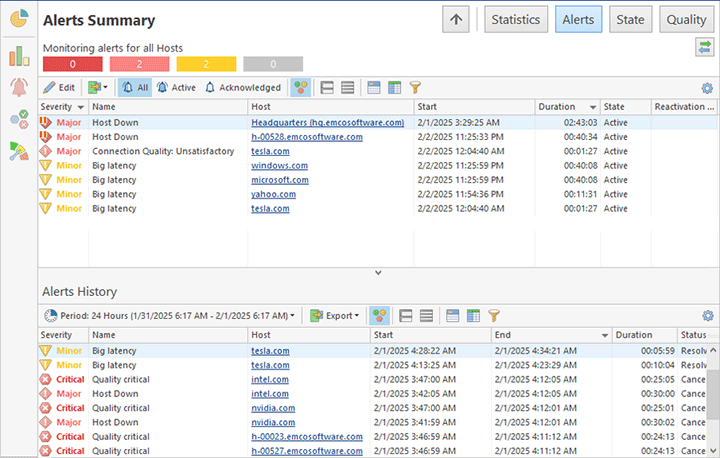
The Alerts Summary page displays alert information in two views. The top view shows a list of active alerts detected on monitored hosts, representing active monitoring issues. The bottom view contains the Alerts History, listing previously detected alerts. This view helps you review alerts reported for monitored hosts in the past.
In both views, each row represents an alert for a specific host. Columns display details such as host name, alert name, severity, duration, and other alert characteristics Pic 1. The summary page provides an overview of alerts for all monitored hosts referenced in the document.
You can use data grouping, filtering and sorting options available for the table interface to represent data according with your needs. You can switch between different modes of Alerts Summary using the corresponding buttons on the toolbar.
You can manage active alerts displayed in the top table of the Alerts Summary page using the buttons available on the table's toolbar.
|
Edit The Edit button allows editing a selected alert, so you can change the alert severity or acknowledge the alert. |
|
All The All button allows you to display all active alerts, including the alerts in the Active and Acknowledged states. |
|
Active The Active button allows you to display alerts with the Active state only. |
|
Acknowledged The Acknowledged button allows you to display alerts with the Acknowledged state only. |
For the Alerts History table, you can manage the displayed data using the following button on the table's toolbar:
|
Period The Period button lets you select the time range for historical alerts to be displayed in the table. |
The following buttons are available for both tables – the table with active alerts and the Alerts History table. You can use them to manage the displayed data.
|
Export The Export button allows exporting alerts information displayed on the screen. |
|
Highlight The Highlight button turns on coloring of the alert severity text in the table, so you can find alerts with the critical problems easier. |
|
Full Expand The Full Expand button expands all grouping nodes, if grouping is turned on for the table. |
|
Full Collapse The Full Collapse button collapses all grouping nodes, if grouping is turned on for the table. |
|
Group By Box The Group by Box button enables data grouping in the table by the values of the selected columns. When this option is enabled you can drag & drop a column to the appeared area to group data by values of this column. |
|
Choose Columns The Choose Columns button allows you to select columns that should be displayed or hided on the displayed table. |
|
Filter Editor The Filter Editor button should be used to define the custom filter criteria to be applied to the monitored entries. |
The active alerts, reported in the top view, allow you to discover the current problems with the monitored hosts. To help you managing the problems there are two types of alerts – active and acknowledged alerts. Active alert means that there is a new problem. If you know about the problem and work on resolving it, you can acknowledge the alert permanently or for a specific period of time. Acknowledged alerts are displayed with the corresponding state, so you easily identify them and don’t mix with active alerts.
You can acknowledge alerts by editing them and enabling the acknowledge options. To manage an alert use the actions available in toolbar or on the Alerts tab of the contextual Alerts Tools menu on Ribbon. Alternatively you can use context menu for alerts to acknowledge them with just a single mouse click.
Host Alerts
In the Alerts Summary page you can see all alerts for all monitored hosts. Note that alerts can be detected by different conditions that you can configure and customize, so the list of alerts can contain different alerts for the same host and alerts for the different hosts as well. For each alert Alerts Summary reports the name of the host where the alert is detected. It is the same for both the active alerts and alerts history views. These names work as hyperlinks, so you can click them to navigate to the host level and see all alerts for a specific host.
The list of alerts for a host is identical to the Alerts Summary. It is represented with the identical views with active alerts and alerts history, but on the host level you can see alerts reported for a specific host only. You can return to viewing alerts for all hosts by pressing the Up button on the top navigation bar.


