Overview
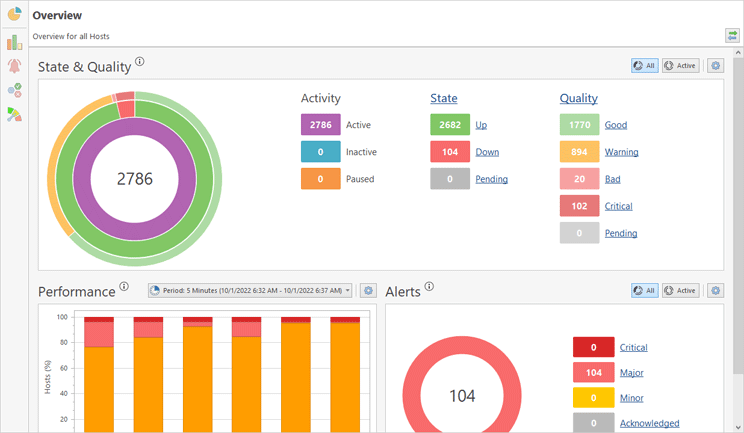
The Overview Pic 1 is designed to provide you with the brief information on monitored hosts and their states. It is located within a document, in the middle of the main program window and can be opened using the document navigation panel. You can either overview the entire monitoring system or focus on specific host and/or groups.
In the State & Quality area of Overview the information is summarized in a doughnut chart, so you can easily see the distribution of hosts with different states and quality. Inside a doughnut itself, you can find the total number of host you are focusing. The first column of the legend displays the count of active, inactive and paused hosts – this distribution is represented with the inner doughnut. For the hosts the monitoring is active for, you can find the information on how many of them are up and down, as well as how many hosts the state is being determined for. This distribution is displayed in the second column of the legend and the middle doughnut respectively. The last column is used to describe the connection quality to monitored hosts. The distribution is reflected in the outer doughnut on the chart. If you would like to focus on host states and connection quality distribution for active hosts, click the Active radio button in the right top corner of the area. To switch back to all hosts use the All button.
The State & Quality part is interactive. You can click the values for states and qualities to drill down to the hosts with the corresponding quality and state.
The Performance chart shows historical characteristics of the monitored host and displays how many hosts had particular performance characteristics during the selected period. You can switch the period to see the overall performance change over time.
The Alerts chart shows the number of alerts that are active or acknowledged at the current moment. The alerts are grouped by severity, so you can see how critical these alerts are. You can click the displayed numbers of alerts to navigate to these
To refresh the Overview pertaining to the selection within the Hosts view, you can enable the Link to Hosts View item in the toolbar.
