Generic Reports
Ping Monitor allows you to generate reports based on historical data for any set of hosts and for any period from the past. The generated report can be either sent via e-mail or saved to the reports storage. Let us take a look at generating reports from a scratch.
|
Generate Report The Generate Report button from the Reporting Ribbon group on the Home page should be used to generate a performance and availability report for any period of time. |
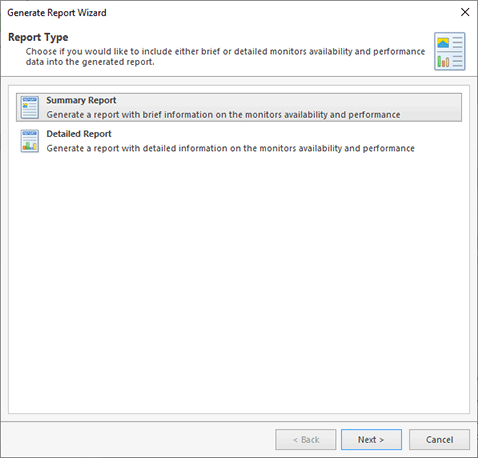
To generate a new report at the current moment, you should use the Generate Report button from the Reporting Ribbon group on the Home page. The wizard will be displayed on the screen to guide you through the steps of the report generation process Pic 1.
On the first page of the wizard, you are proposed to choose the type of the report to be generated. The Summary reports provide you with a brief information in a form of a table, where each row represents a single host, and the Detailed report contains a wider range of data and consists of multiple sections, where each section stands for a single host. When the report type is chosen, press Next.
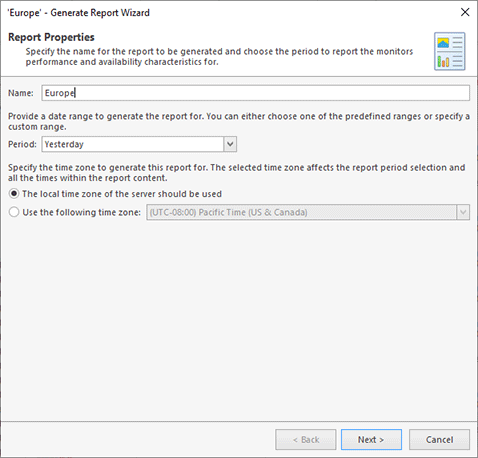
On the next page of the wizard Pic 2, you are proposed to specify the report properties. Those are the report name and the period to generate the report for. You can choose between the predefined periods available in the Range drop-down, or choose the Custom Range value and specify the required period. When the detailed report is generated, the level of details will be adjusted to the report period automatically. Next to the report range, you can specify the time zone used for generating the report. The selected time zone affects the selection of the report period and all the times within the report content. You can either use the local time zone of the monitoring server, which is the default behavior, or choose a specific time zone.
On the next pages, you are proposed to choose a list of report members and define report output options. In case the Hosts view or the Statistics view was active while initiating a generic report generation, the selected hosts and groups are automatically added to the report members. For the detailed information on report members configuration, refer to the Report Members section of this document. You can filter the members based on their performance and availability characteristics by specifying the Report Filter. As for the reports output, you can save it to the file or send via e-mail, and indicate which information should be included into the detailed report. The outputs configuration is described in the Report Outputs section.
After you have configured the report options, press Finish for the report to be generated. As you can see, creating a generic monitoring data report is a fast and easy process, and you should be able to use it in the everyday work without any difficulties.


