Program Navigation
The program allows you to work with the different types of data and perform the different operations. For example, you can manage hosts monitored by the program, review monitoring results, generate reports, etc. These operations can be performed in the different views described below.
Hosts Management
To start monitoring hosts you need to add them into the program. You can do it in the Hosts view that is displayed by default in the left side of the main screen.
The Hosts view allows adding and removing hosts to the program, exporting/importing hosts and configuring hosts settings. This view allows you to organize hosts into groups to create hosts hierarchy and for managing multiple hosts as a single entity.
In the Hosts view to can start and stop monitoring of the hosts and see hosts, which are monitored currently. Note that the view doesn’t provide any information about host state, statistics or other results of monitoring. This information is provided by other views, described below. The Hosts view is used for managing hosts and activating their monitoring.
Working with the Monitoring Information
All hosts monitoring information collected by the program is represented in the document interface, displayed by default at the center of the main screen. A document contains all monitoring results and allows you to navigate through the monitoring data quickly and easily. When you open the program at the first time, you can see a default document, which displays the monitoring information for all hosts. If required, you can open additional documents to display monitoring results for selected hosts or to tune data representation within the document.
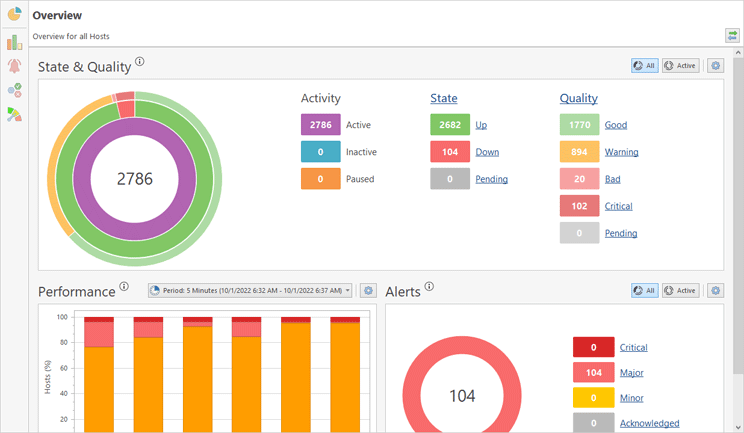
In the document you can navigate through the monitoring information using the navigation panel, located at the left side of the document Pic 1. By default the program shows Overview, that displays charts representing the current state of monitoring. You can click the buttons on the navigation panel to open the Statistics Summary, Alerts Summary, State Summary and Quality Summary pages.
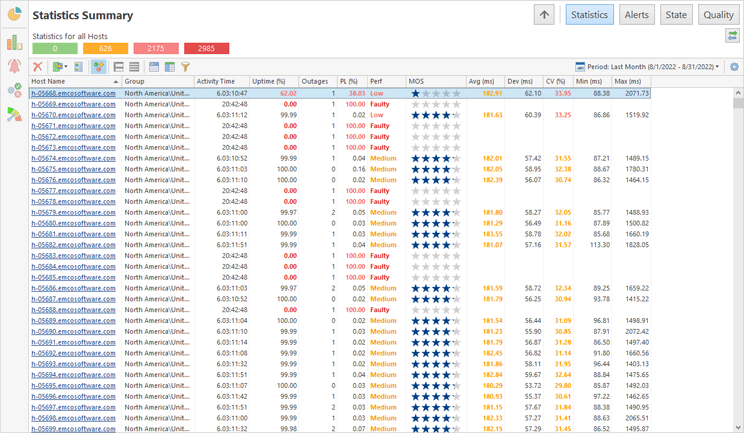
You can use the navigation panel to navigate through specific characteristics of the monitoring data. For example, the Alerts Summary page displays active alerts and alerts history, the Statistics Summary page displays states of hosts. The Overview page and the summary pages with statistics, alerts, state and quality, display information for all hosts on a single screen Pic 2.
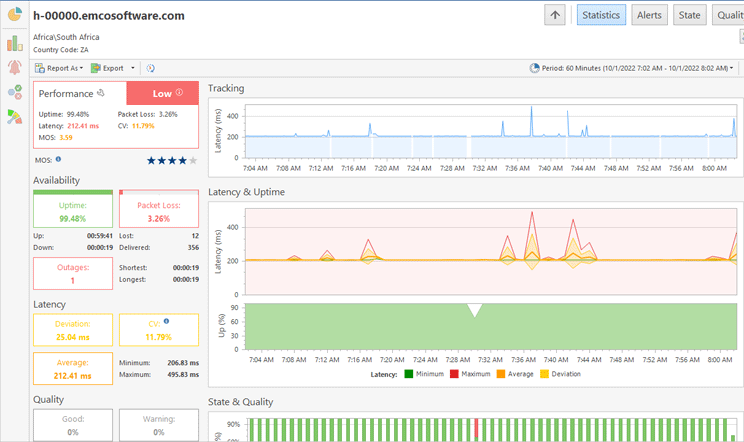
If you need to see detailed information about a specific host, you can click it in on a summary page. It works as a drill-down from a list of hosts to a selected host. For example, if you click on a host in Statistics Summary, you will navigate to the Statistics page of the clicked host. It displays all statistics collected for the host Pic 3.
When you are on the host level, you can review all other information, available for the host. Use the navigation bar, located on the top right corner. It allows you to switch to Statistics, Alerts, State and Quality pages of the host. You can also use the Up button to navigate to the upper level Pic 4. On the left side of the navigation bar you can see a host name or a name of the current page, so you can always know your current location.
You can use either the navigation panel or navigation bar to navigate through the hosts, but the navigation panel buttons allow you to open summary pages displaying information for all hosts with a single click. Using the navigation bar you can walk through hosts hierarchy and navigate through different pages of the host.
As mentioned above, the program allows you to work with multiple documents. For example, you can open documents with different hosts. To create a new document click on the Document button in the New group of the Home menu on Ribbon. In this case the program creates a new document with all hosts. To create a document with specific hosts select the hosts in the Hosts view, then right-click and choose Show Overview In and then New Document. You can change a list of hosts displayed in the view by enabling the Link with Selection option in the document and selecting hosts in the Hosts view.
Documents are displayed as tabs, so you can switch between them quickly. You can right-click a document tab to pin, rename or duplicate it. You can also undock a document by dragging its title and dropping to another location on the screen to reorganize visual layout of the program.
Managing Reports
You can configure and run reports using the Reports view. To open it, click the Reports tab, located by default at the left bottom corner of the main screen. The Reports view displays available reports, you can create a new report or run a report in this view.
Access Control, Log and Operations Management
You can configure users, which can use the program, in the Access Control view. In the Log view you can see logging events generated by the program. The Operations view displays a list of running operations. All these views are displayed in the corresponding tabs that are located at the bottom of the main screen.


