Monitoring Connection Quality
The host state monitoring represented in the previous chapter is one of the main features of the program because it allows you to detect changes in the host state. It is very important to know when the monitored host goes Down, and when the host is Up, but it is also important to estimate its connection quality. Monitoring of the quality of the connection allows you to estimate its current, real-time characteristics and qualify it as Good, Warning, Bad or Critical. Connection quality monitoring allows you to quickly identify potential network problems and resolve them before they are escalated.
How Connection Quality is Detected
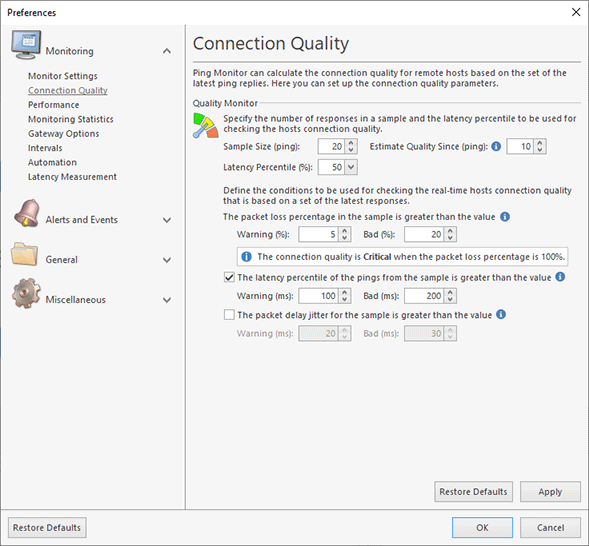
The program uses ping results to calculate the connection quality metrics of the monitored host. The connection quality is a real-time value detected at the current moment, so the program uses the latest ping results to calculate the quality metrics. By default, the program uses the packet loss and the latency to detect the connection quality, but it is possible to use the jitter metric as well. The quality metrics are configured on the Connection Quality page of the program preferences, where you can tune the settings used Pic 1.
By default, to calculate the packet loss, latency and jitter for a host, the program uses the last 20 ping results. To detect the connection quality, the program uses both the packet loss and the latency. With the default settings, the quality is reported as Good if the packet loss is below 5% and the latency percentile (50%-ile) is below 100 ms. The Warning or Bad quality is reported if any of the metrics exceeds the specified thresholds. For example, the Warning quality is reported if the packet loss for the monitored host is 10%. The Critical quality is reported when the packet loss is 100%, it means that the host doesn't reply to pings, so there is no connection between the monitoring server and the monitored host.
By default, the common settings configured in the program preferences are used to detect the quality of all the hosts. It is possible to override the common settings and specify individual settings for hosts and groups.
Using Quality Summary to Track the Quality of Hosts and Groups
After the hosts have been monitored, you can see the quality statistics displayed in the Overview view, where you can see the number of hosts with a Good, Warning, Bad and Critical quality. By clicking on the displayed numbers, you can navigate to the hosts with the selected characteristics.
To see the quality values of all the hosts, you can switch to Quality Summary by clicking the corresponding button on the navigation panel.
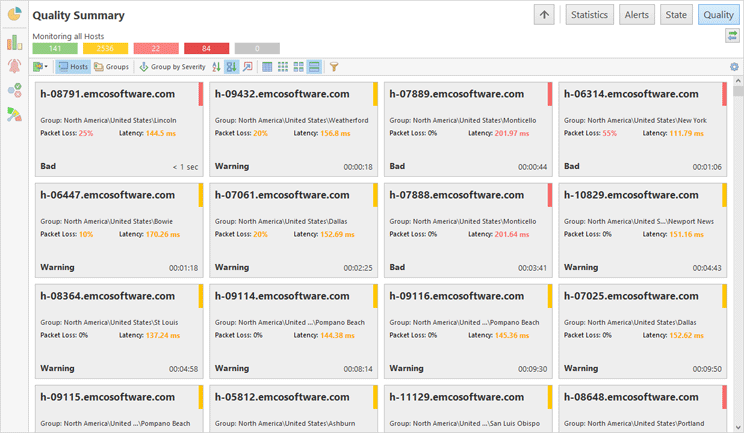
By default hosts are displayed as tiles. This representation is designed for control rooms and can show the connection quality of all the hosts on a single screen. The connection quality is represented in different colors, and the key quality metrics are displayed for every host. This view allows you to identify, for example, the hosts with a Bad quality and see the metrics used to define the quality as Bad Pic 2.
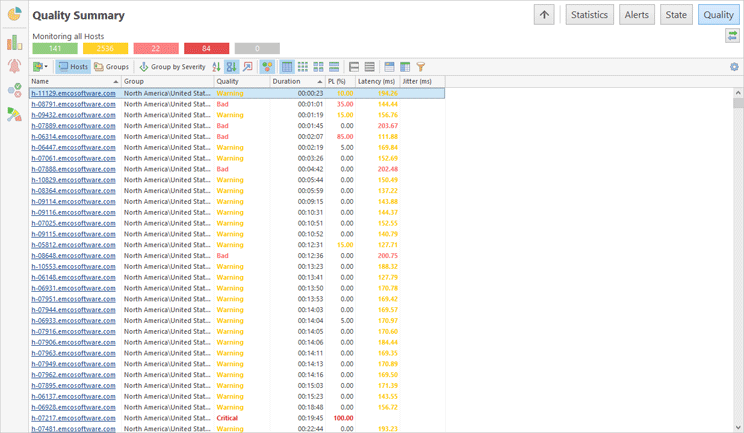
Alternatively you can display hosts and their quality as a table Pic 3. Click the Table button located on the toolbar above the displayed data to switch to the table presentation.
The data visualization in Quality Summary is similar to the data visualization in State Summary, so you can use the same approaches to managing data. In particular, you can display hosts and groups in the view and use data sorting, grouping and filtering features, which are explained in the Monitoring Host State chapter.
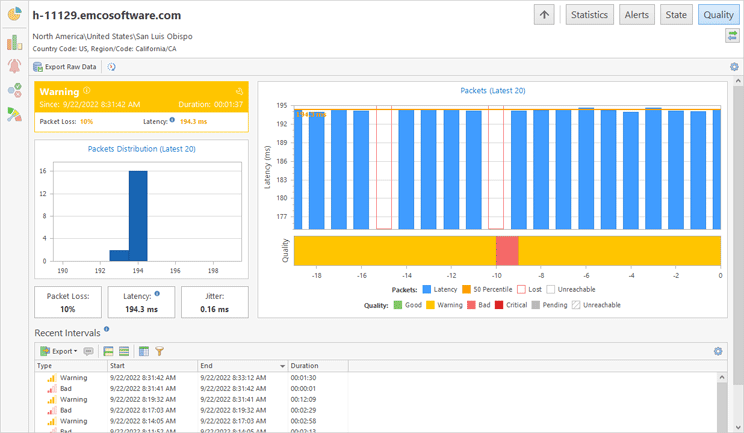
In the Quality Summary page you can click a host to drill-down and see quality metrics for the host. The latest ping results used to calculate the quality metrics are displayed in a chart together with the latency percentile value. On the same screen, you can also see the packets distribution chart and the calculated metrics of the packet loss, latency and jitter.
By navigating to host details, you can see the ping results for the host in real-time and track the quality changes.
Best Practices of Connection Quality Monitoring
To monitor the connection quality, you can use the same approaches as explained in the Monitoring Host State chapter. If you plan to use the program in a control room, you can open Quality Summary for a visual tracking of quality changes. For example, you can configure a filter to display hosts with a Critical, Bad and Warning quality only, so if any host with those characteristics appears on the screen, you will be able to take the required actions to resolve the problem.
Another approach is based on using notifications sent by the program when the quality of the connection to a host changes. For example, you can create an alert that will send you notifications when connection quality reaches a specified value. In this case, you don’t need to open the GUI client because the program will notify you about all problems itself. The notification messages contain detailed information about the host and its metrics.
By default, connection quality notifications are turned off in the program preferences, so you need to enable them. This topic is described in the Managing Notifications chapter.


