Generating Reports
Ping Monitor includes built-in reporting features, so the program can automatically generate reports for you. Reports can be managed on the Reports view, where you can create reports of two types: summary and detailed. What is the difference between those types of reports?
- Summary report. This report includes main statistical metrics for multiple hosts. It is represented as a table, with one raw per host. The report includes basic metrics such as the number of outages, uptime, packet loss, performance, MOS, latency average, deviation and CV. This report is similar to information displayed in the Statistics view for all hosts.
- Detailed report. This report includes all available statistics for multiple hosts. The report includes detailed statistics for a host such as the latency, uptime, state and quality charts, state and quality intervals and other data. This report is similar to information displayed in the Statistics view for a host, but it can include data for multiple hosts.
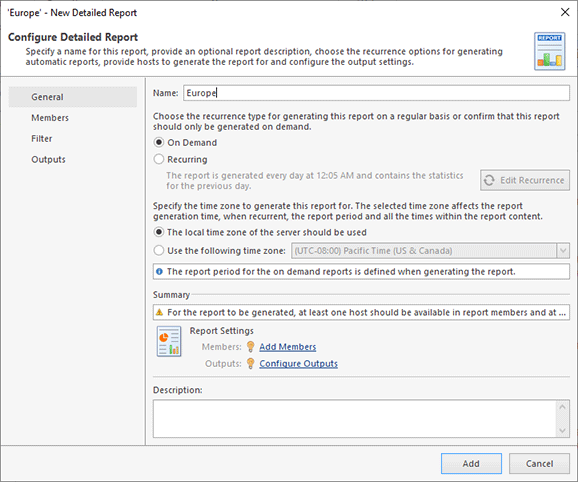
You can manage reports in the Reports view. When creating a new report, you should decide whether it should be a summary or a detailed report, then configure the report settings accordingly Pic 1.
To configure a report, you need to specify the following settings:
- Generation type and recurrence. A report can be generated on demand, when you initiate its generation manually, or it can be generated automatically. For automatically generated reports, you need to specify the recurrence settings. For example, reports can be generated daily, weekly or monthly.
- Members. You need to configure a list of hosts and groups to be included into the report.
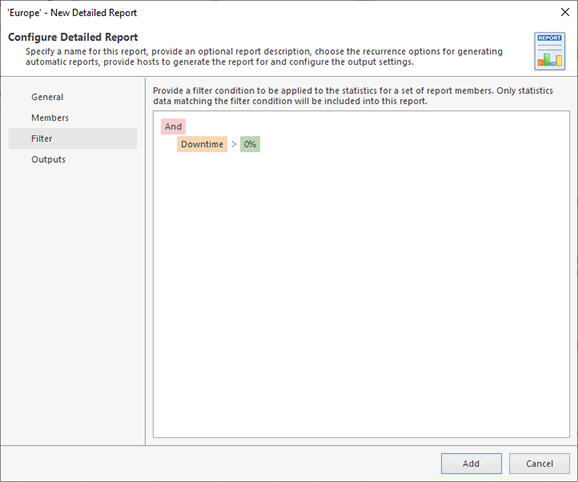
- Filter. You may filter hosts based on specified conditions.
- Output format. The program can generate reports as PDF and HTML files and send them by e-mail, if required. The program can also upload the generated reports to a specified FTP server.
Reports are designed to include information about multiple hosts. So how do you manage the reported data? You can use a filter based on the entered condition, for instance Pic 2. When you configure a daily report, which is generated automatically every day, you should include all hosts that you need to track into this report. For example, you need to include hosts with downtime to analyze problematic hosts only. The list of those hosts can be different every day depending on the monitoring results, but it will always meet the entered condition and be up-to-date.
The reports generated by the program include a preconfigured header and footer. You can customize them and include your own logo and text. This can be configured on the Reports Customization page of the program preferences.

